
How to use the Analytics feature?
After you login to your Joy.Link account, you can see Analytics tab at the top. This article will go over the definition of the terms and how they are calculated.
Making good use of the Analytics tool can help you keep track of your Views and Clicks, so you can find out which links are getting your audience onto your Joy.Link page, and which links they're engaging with when they get there.
- Lifetime data vs 7 days
- What are View?
- What are Click?
- What are Click Through Rate (CTR)?
- What are Visitor Countries?
- What are Referral Sources?
- What are Link Details?
- What are Impressions?
Lifetime data vs 7 days
Lifetime shows the total views, clicks and Click Through Rate for the lifetime of your account, while 7 days only captures the last 7 days.
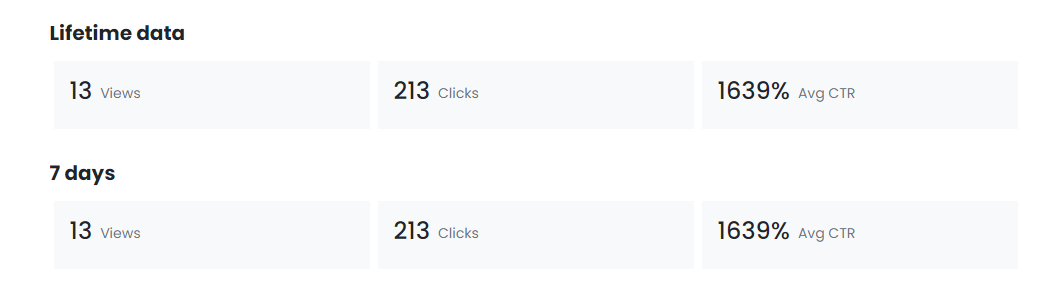
What are Views?
A view is every time your Joy.Link is viewed. A view is an instance of a page being loaded or reloaded in a browser. Views is a metric defined as the total number of pages viewed. One visitor can be responsible for a lot of views and that a page can be viewed multiple times per session.
For example, if 1 visitor lands on your Joy.Link once, that is counted as 1 view. If that visitor visits your Joy.Link another 2 times, that is another 2 views which now equals 3 views.
What are Clicks?
A click is when a visitor clicks on one of your links. Clicks chart shows the total amount of clicks across all of your links.
For example, if a visitor clicks 3 links on your Joy.Link profile, your clicks count on this chart will show as 3 .
What are Click Through Rates (CTR)?
The ratio of visitor who click on your content to the number of total visitors who view your content. It is a way to measure the performance of your links, by telling you the percentage of views that resulted in a clicked link.
If your CTR is 30%, then 30% of your views resulted in a click of one of your links.
For example, if you have received 2,000 clicks and 4,000 views, your CTR would be 50% (1000/2000x100).
Note: that it is possible for CTR to be over 100%, this happens when a visitor clicks more than one link.
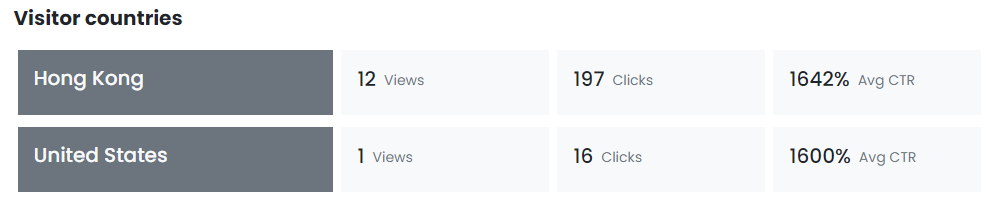
What are Visitor Countries?
The section shows the top countries visitors data breakdown by each country. The location is based on the IP used by the visitor captured by Google Analytics.
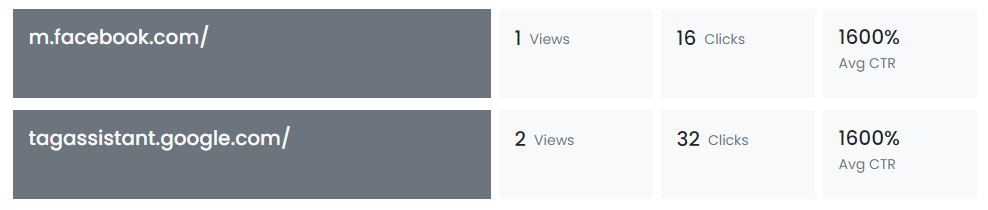
What are Referral Sources?
The section shows the visitor data from each referrer. A referrer is where your visitor came from before landing on your Joy.Link page.
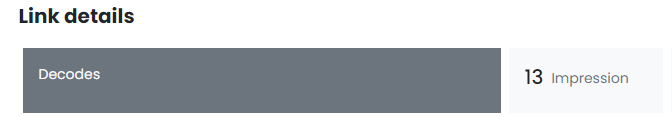
What are Link Details?
The section shows the visitor data for each individual link. This can really help you pinpoint the engagement of each link and measure the performance of your links on a daily basis.
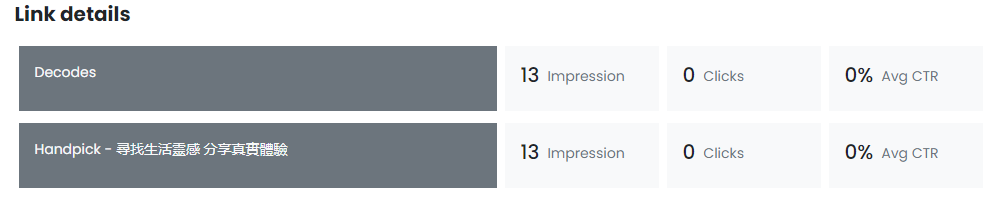
What are Impressions?
An impression is counted each time a visitor views your Joy.Link and the link appears in the page. It will count is a impression even if the link is not being clicked.
If your CTR is 30%, then 30% of your views resulted in a click of one of your links.
For example, if you have received 2,000 clicks and 4,000 views, your CTR would be 50% (1000/2000x100).
Final tips: Try moving less popular links further up or deleting them if they don't perform. Test out different customizations on your buttons and see how that changes the View count. Making data-driven decision can optimize your content & links performance.